![]()
Family Meals Focus
The Ellyn Satter Institute Newsletter
Understanding and using z-scores to track children’s growth
by Ellyn Satter, MS, MSSW, Dietitian and Family Therapist
Children who are very large or very small can’t be accurately tracked on the standard growth charts. To understand and assess their growth, their weight needs to be converted to z-scores. Plotting their z-scores against their age gives an accurate picture of their weight patterns.
Tracking growth for very small or very large children
Growth plotted over time on standard growth charts provides an overview of the child’s physical, nutritional, emotional, and developmental well-being. Accurately plotted growth allows exploring the underpinnings and antecedents of growth distortion and guides intervention. The dilemma arises with respect to tracking children whose weight or body mass index (BMI) plots in the uncalibrated areas above or below the percentile curves on growth charts. While values plotted in these outlying areas show the child’s growth to be extreme, the plottings carry no information about the magnitude of that extremity and give misleading information about patterns of change. To assign magnitude and detect patterns, we can convert their growth values to z-scores, or standard deviations above and below the mean.
Josh, the small and slowly growing
Josh’s growth plottings offer an example of a child growing below the growth chart. Josh’s early weight-for-age growth chart plottings are hard to see and have no significance in terms of magnitude. From hospital discharge, Josh was fed on demand by his parents. At age 2½ months, assessing his growth to be inadequate, the physician advised Josh’s parents to feed a certain amount of formula on a certain schedule. Formerly harmonious feedings became a struggle, and Josh’s growth rate seemingly decreased. The z-score plotting shows a clearer picture, one that would have been instructive to the physician. While Josh was being demand-fed, his weight had been slowly but steadily increasing toward the mean, by over one z-score from his discharge weight. After his parents began feeding him prescriptively, his growth faltered, returning almost to his z-score baseline.
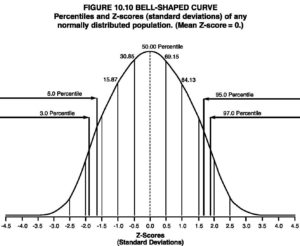
What is a z-score?
The bell curve on the right illustrates the principle of z-scores. The z-score is the standard deviation (SD) above or below the mean. A z-score of 0 is at the apex of the curve and is the same as a 50th percentile, a z-score of ± 1.0 plots at the 15th or 85th percentiles, respectively, and a z-score of ± 2 plots at roughly the 3rd or 97th percentiles. At birth, Josh’s z-score was at about -3.7, or 3.7 SD below the mean. That is well below the third percentile, but Josh’s was holding his own with weight, and his weight had gradually crept up by about one SD before it was driven back down by pressured feeding.
Erica, the large and rapidly growing
Erica’s growth plottings illustrate the same principle at the other end of the bell curve. Erica’s weight plotted at the 90th percentile weight for age at birth and by age 2 months had accelerated to well above the 97th percentile. In contrast to the growth chart, which shows her early weight to be going up and up, the z-score plotting shows her weight to accelerate abruptly beginning at birth, then stabilize at about + 3.0 to 3.5 SD, or z-score, by age 2 months. At age 3 years Erica’s weight began a slow and steady decline to reach an eventual low of just over 1.5 SD at age 6.5 years. What story does Erica’s z score graph tell? Alarmed by her large size and hearty appetite, Erica’s parents began restricting her food intake at birth. This seemingly exacerbated her food demands, and her weight accelerated rapidly. At age 2 years, Erica’s parents read Child of Mine: Feeding with Love and Good Sense and instituted the division of responsibility in feeding. After a few weeks of getting organized with family meals and snacks followed by more weeks of Erica’s eating a great deal, Erica’s eating settled down, and her z-score leveled off and even decreased.
How to calculate z-scores
You may be so lucky as to have a program or electronic health record charting system that calculates weight for age z-scores, or standard deviations. You can purchase a program that plots growth and calculates Standard Deviations. There is also a simple web-based calculator that will allow you to calculate z-scores using the child’s gender, age (in months or by birth date and evaluation date), and weight. These calculations use an embedded statistics program and CDC parameters and data. There will be slight differences in SDs among the methods but it doesn’t matter as long as all the figures for a given child come from a single method. Plot the z-scores or SD values against age (a spreadsheet works great) and generate a graph to get a picture of the child’s z-scores over time. If you have SAS statistics program software, after the usual steep learning curve, calculating z-scores is easier. To use your SAS program to calculate weight for age z-scores, download the growth chart data and SAS programming information from the CDC.
Be sure figures are accurate
That’s it, except for one caveat. Only accurate values can legitimately be tracked. In the usual pediatric clinic practice, length or height tends to be taken casually, then weight for height or BMI is calculated using faulty height data. As a consequence, for many children, weight represents the only reasonably accurate parameter. Weight for length or weight for height that is calculated based on inaccurate lengths or heights is also inaccurate. Thus, the only choice available for a clinician, and it is a highly serviceable one, is converting the child’s weight for age to a z-score and tracking it over time.
World Health Organization (WHO) growth charts.
Make that two caveats. You may be aware that the World Health Organization provides growth charts based on z-scores, or zed scores, as they call them. Moreover, the child data used to calculate the curves is different from the CDC growth charts, so the plottings are different. Neither Josh’s nor Erica’s growth looks as extreme plotted on WHO charts. However, there will still be a few children whose growth is too extreme to fit on even the WHO charts.
More about assessment
Your Child’s Weight: Helping without harming
- Appendix E: “Assessment of feeding/growth problems”
- Appendix F: “Treatment of feeding/growth problems”
Explore
For help with raising your big child or your small child to feel good about himself and have the body that is right for him, read Ellyn Satter's Your Child’s Weight: Helping Without Harming